Research, screen.is
Digital CO2 analysis
Estimates of total size
- According to researcher Gautheir Roussilhe there are three main schools of thought for [[Modelling]] ICT climate emissions. In addition:
- Boston Consulting Group, 2021 - refers to 3-4% of global emissions https://www.bcg.com/publications/2021/building-sustainable-telecommunications-companies. This was up from 2% of global emissions, 1 billion tonnes in 2018. https://www.sciencefocus.com/science/what-is-the-carbon-footprint-of-the-internet/.
- Meta review by Tom Greenwood - "Reviewing the academic literature on the energy consumption of internet data, we found that figures varied from the lowest of 0.004 kWh/GB to 136 kWh/GB" https://www.wholegraindigital.com/blog/website-energy-consumption/ - and settled on 1.8 kWh/GB
It's only growing
- "if unchecked, ICT GHGE relative contribution could grow from roughly 1–1.6% in 2007 to exceed 14% of the 2016-level worldwide GHGE by 2040" https://www.sciencedirect.com/science/article/abs/pii/S095965261733233X?via%3Dihub
- "BCG predicting that data centers alone will use 8% of global electricity by 2030." https://www.bcg.com/publications/2021/building-sustainable-telecommunications-companies -
What is the unit of measurement?
Many favour the focus on KwH per GB as the CO2eqv will vary based on location for instance:
"In France, where I live, producing 1 kilowatt.hour of electricity emits on average 55g of CO2 equivalent (it's much less than most other countries, e.g. Germany's electricity emits 440g eqCO2/kWh, and the US 450gCO2/kwh, but in return, we have nuclear waste buried underground for milleniums to come)." https://marmelab.com/blog/2020/09/21/web-developer-climate-change.html
What is 100g of CO2?
A great tool for finding real-world equivalencies to emissions quantities is https://www.epa.gov/energy/greenhouse-gas-equivalencies-calculator.
From https://marmelab.com/blog/2020/09/21/web-developer-climate-change.html:
- Breathing alone emits about 1kg CO2 per day
- A car trip emits 1.9kg CO2 for 10km
- Producing a t-shirt emits 5 kgs of CO2, and a tennis racket 23kg of CO2
- A 150g beef steak emits 5.4kg of CO2 equivalent
- A red rose bought for Valentine's day emits more than 350g of CO2
Some measurement tools
The first four all follow the 'enter your URL', get a readout method:
- Website Carbon Calculator: https://www.websitecarbon.com/ - uses the Green Web Foundation's [[Green hosting]] directory API, and Anders Andrae and Tomas Edler 2017 paper to create a network estimate of 1.8kWh/GB. Also avaiable as a script/widget to display CO2 per page. - Ecograder: https://ecograder.com/ - uses the Green Web Foundation's [[Green hosting]] directory API
- Ecometer: http://ecometer.org/ - looks at design practices (http requests, plugins, css compression, fonts, image resizing, etc)
- GreenFrame: https://greenframe.io
- Microsoft Sustainability Caluclator: https://appsource.microsoft.com/en-us/product/power-bi/coi-sustainability.sustainability_dashboard
- Power API: https://powerapi-ng.github.io/index.html
- EcoIndex - http://ecoindex.fr/
France seems quite developed in this space; as well as GreenFrame, there's https://greenspector.com/en/home/, http://www.ecoindex.fr/, http://ecometer.org/, https://theshiftproject.org, GreenFrame.io & Marmelab. A great explanation of the difference in the French approach is described by Gauthier Roussilhe here.
Example
DEFRA - ICT emission reduction analysis https://assets.publishing.service.gov.uk/government/uploads/system/uploads/attachment_data/file/997523/ict-annual-report-2019-20.pdf
Some Models
GreenFrame.io
https://greenframe.io/ | developers include Pierre-Etienne Moreau, François Zaninotto | contact@greenframe.io
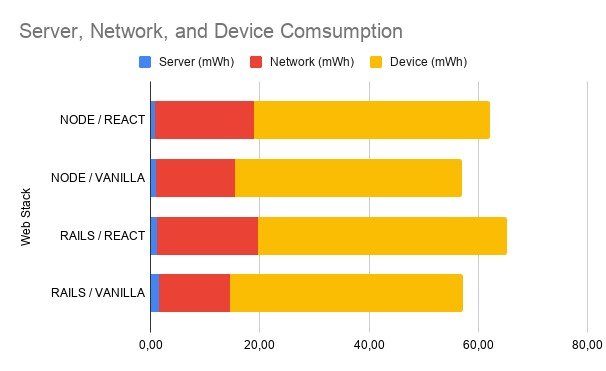
One of the more developed models, by the French developers MarmeLab, it distinguishes between three CO2 origins: CPU, Network and Screen. So a [[Static Site Generators]] might have a lot less carbon in its delivery onliny, but the CPU build might be offset the gain if the build happens frequently (MarmeLab do a good comparison of the two here). More info.

An advantage of GreenFrame is it can help you design systems that minimise footprint in the areas outside of control (screen, network to an extent) and focus on what can be controlled – CPU/server end. In the analysis above they found the screen was responsible for 72% of the energy in some processes, concluding "the importance of screen consumption (in a desktop client) validates efforts to improve the performance of web apps: the longer it takes for a user to achieve a task, the more energy they consume".
On Global Electricity Usage of Communication Technology: Trends to 2030
by Anders Andrae and Tomas Edler https://www.mdpi.com/2078-1547/6/1/117#abstract
As reported in Nature, and used by Website Carbon Calculator - to give 1.8kwh/gb.
Examples
Analysis for visuali.st:
- Ecometer - http://ecometer.org/report?url=https%3A%2F%2Fvisuali.st%2F
- Greenframe - https://greenframe.io/results/visuali-st
- Website Carbon Calculator - https://www.websitecarbon.com/website/visuali-st/